Reach 1 in 5 people in Spain.
10
cities
3.7 M
mailboxes
9.5 M
people
Are flyers worth it for you?
Two answers. One number.
The figure Google or Meta shows you. Leave it empty if you don't know it.
2.Out of 10 leads, how many buy?
Not sure? Two out of ten is a fair start.
2 of 10 buy.
We count 2 responses per 100 flyers in mailboxes and 3.5 hand to hand. In real campaigns we measured 4.1% in mailboxes and 3.3% to 4.8% hand to hand.
What a customer costs you
45 €
per customer with Carto
Type what a lead costs you in step 1 to compare.
- Smallest campaign
- 25,000 flyers
- Responses
- 500 · 9 € each
- Customers
- 100
- Price, all in
- 4,500 €
That is 18 cents per mailbox. And you know which one answered.
Your flyer in every mailbox of the districts you pick, full coverage by default. From 25,000 mailboxes, with volume pricing: the more you cover, the less each mailbox costs.
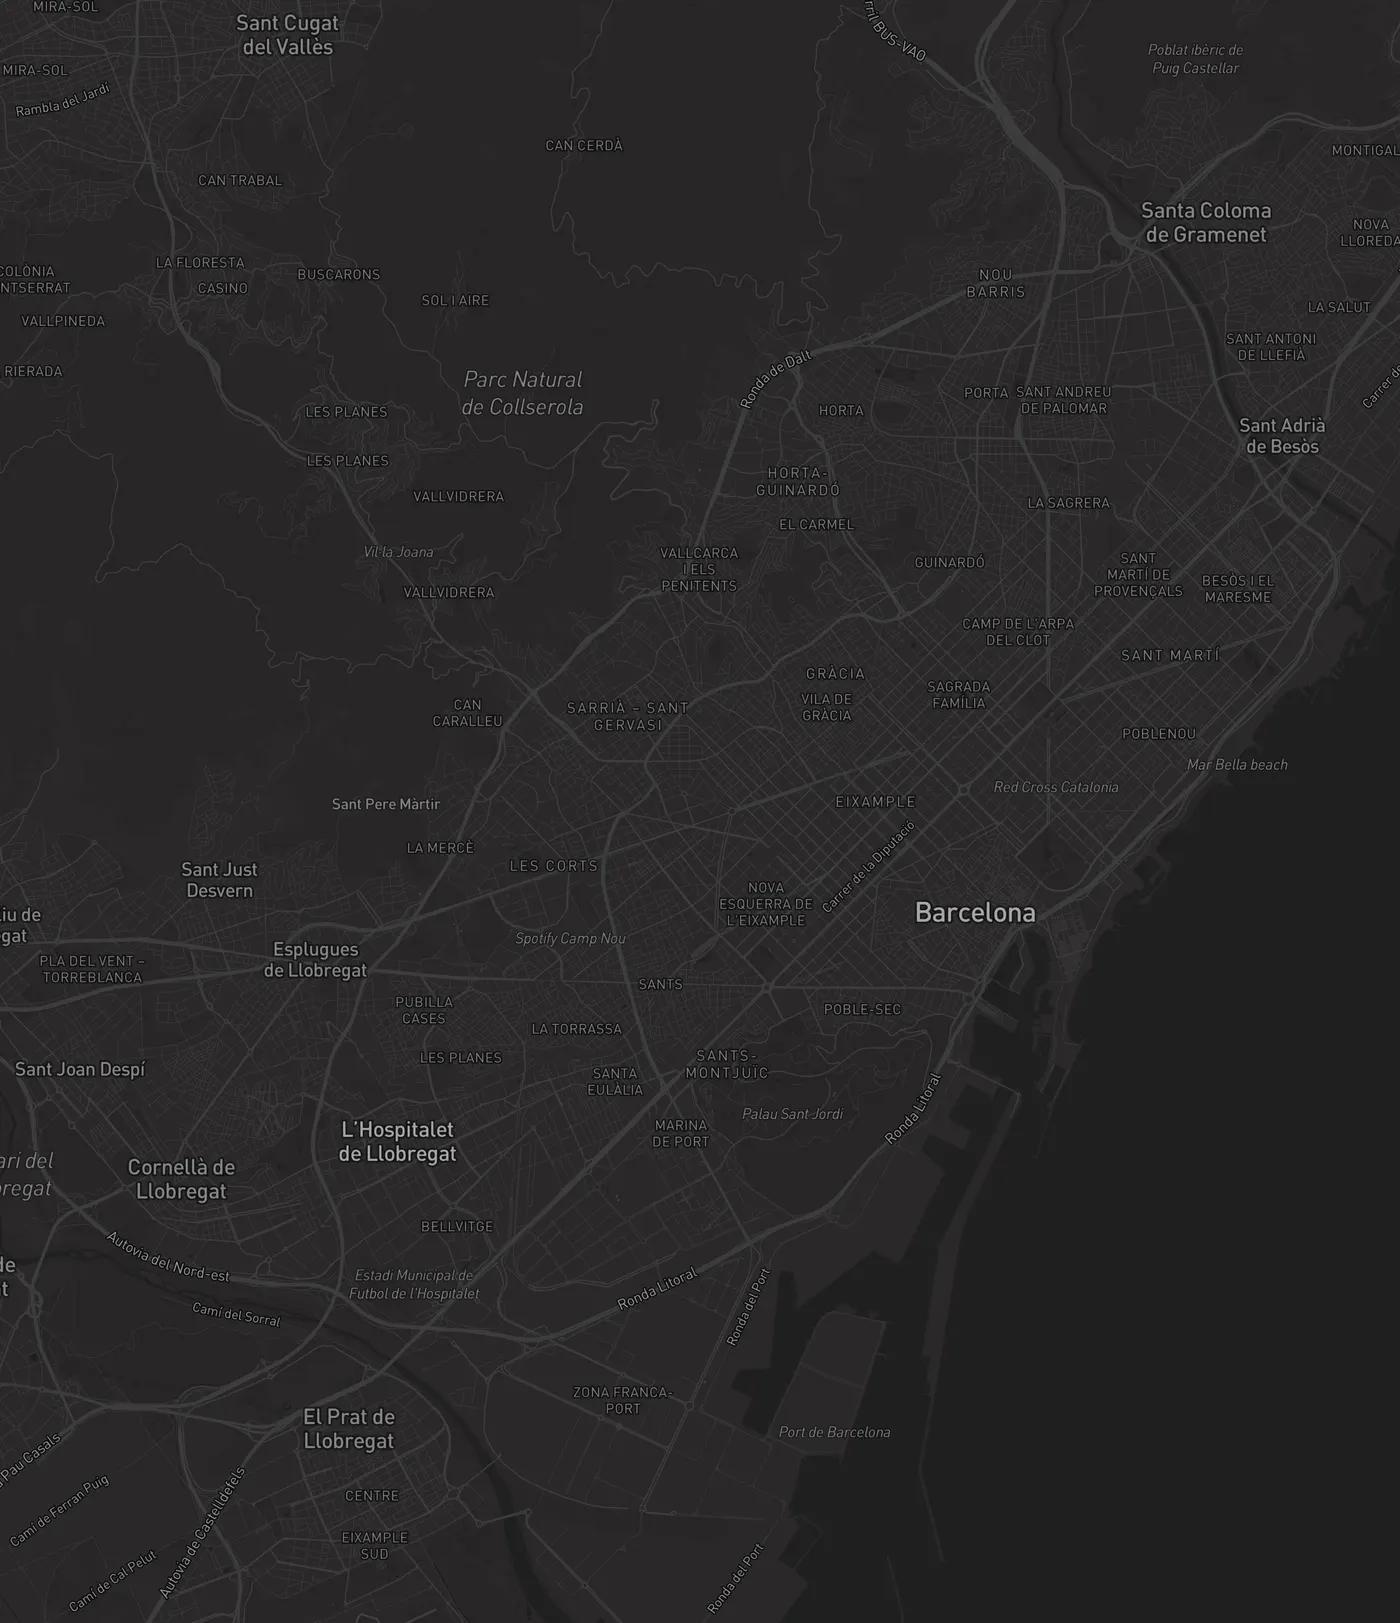
Tap a district to add or remove it · scroll or pinch to zoom · double-tap to fly in
The bar compares each district's average income with the highest-income district of this city.
Official data: 2026 municipal register and 2023 disposable income per person, Open Data BCN. District boundaries: Barcelona City Council.
Your Barcelona campaign
684,077
mailboxes covered · estimated reach 1.7M people
1.7M people
estimated people reached · GPS route, photo proof and live dashboard included
Every campaign includes printing, flyer design if you need it (free), GPS-verified distribution, photo proof and a live dashboard. Tell us your goal and we send a tailored proposal the same day.
Your audience
26,125 €
avg income/person a year
44 yrs
average age
51.9%
women
Compare it with your current marketing
Below, what this campaign would deliver scenario by scenario, from measured campaigns. Type what a lead or a customer costs you today and you will also see your cost per lead with us and the difference. Every response arrives geolocated: the dashboard shows the zone each person scanned your offer from, so you know which district converts and where to repeat.
Estimated response rate → responses
Conservative · 0.5%
3,420 responses
Typical · 1%
6,841 responses
Strong · 2%
13,682 responses
Our real campaign · 4.1%measured
28,047 responses
Conservative and strong are the sector range. The 4.1% is the real response of our verified door-drop campaign in Poblenou (2026); hand to hand we measured 3.3 to 4.8% across two campaigns. These are estimates, not guarantees: we guarantee the distribution, the response depends on your offer.
Estimated calendar: 6 months
4 weeks of production plus 5 months of distribution, with one team of 2 Brand Missionaries. A larger crew can compress it: tell us your deadline.
Printing, distribution and verification included. Every delivery with GPS route and photo proof, every response geolocated on the map and a live dashboard for the whole campaign.
The URL of this page stores your selection: copy it to share the estimate.
Your city is not among the 10? We distribute across all of Spain: tell us your city.
Prefer to explore first? flyer distribution in Barcelona · how we verify door drops · case studies with real data